Nursery again tops list of Oregon commodities
Published 5:00 am Monday, November 4, 2019
- Ore. top 10 ag products
PORTLAND — Greenhouse and nursery products continue to reign as Oregon’s most valuable agricultural commodity, with goods nearly topping $1 billion in 2018, according to data compiled by the Oregon Department of Agriculture and USDA National Agricultural Statistics Service.
The agencies released their annual brochure of facts and figures about Oregon agriculture on Oct. 31, including crop production, acreage and livestock inventory over the previous year.
Dave Losh, Oregon state statistician for NASS, said most of the information comes from surveys collected directly from farmers and ranchers across the state.
“We have a cooperative agreement with (the state), and it goes back to our mission of providing timely and accurate statistics on agriculture,” Losh said. “We’re able to focus on Oregon agriculture, which has a lot of diversity.”
Oregon famously grows more than 200 different agricultural commodities, from wheat and cattle in the east to grass seed, hazelnuts and Christmas trees in the lush Willamette Valley.
The USDA ranks the top 20 most valuable agricultural commodities in Oregon, and while Losh said the list does fluctuate each year depending on crop prices, the greenhouse and nursery industry has routinely led the pack since 2009.
Ten years ago, greenhouse and nursery products were valued at $732.5 million. In 2018, the total was $995.9 million — a 35% increase.
Losh said there were few other major surprises in the top 20, compared to 2017. Cattle and calves remained number two, at $652 million, and hay number three at $590.4 million. Grass seed and milk flipped spots at fourth and fifth, respectively, likely due to lower dairy prices.
Winegrapes rose two spots to seventh, breaking $200 million for the first time. Hazelnuts remained 13th, though the value climbed from $73.6 million to $91.8 million as more acres reach nut-bearing age.
One notable absence from the top 20 is industrial hemp. Losh said the USDA did not collect data on hemp last year, since it was only legalized under the 2018 Farm Bill last December.
“USDA is still working through the process of how to put in regulations and put in a statistics program for hemp,” Losh said.
The Oregon Department of Agriculture issued permits in 2019 for more than 63,000 acres of hemp, which is more acreage than potatoes and onions combined. It remains unclear how many acres of hemp will actually be harvested.
Medical and recreational marijuana, meanwhile, is not regulated by ODA, but rather the Oregon Liquor Control Commission.
The 2018 facts and figures brochure also contains general information about Oregon farms and ranches, which were previously reported by NASS in the 2017 U.S. Census of Agriculture.
Oregon has 37,200 total farms over 16 million acres. Local farmers lead the country in production of several crops, including hazelnuts, grass seed, Christmas trees, rhubarb and blueberries, while ranking second in crops like pears and mint and third in hops and onions.
Losh said the figures are intended not only for producers, but state lawmakers and local governments to provide a full picture of Oregon’s agricultural production and value.
“We hope it’s valuable for lawmakers, particularly the Oregon legislature and local government as well, when they’re making decisions regarding agriculture,” he said. “We’ve seen some loss in farmland due to urban expansion and other uses, and we are fully supportive of trying to make sure that good farmland stays in production.”
The Oregon Department of Agriculture and USDA National Agricultural Statistics Service have compiled the state’s top 20 agricultural commodities by value for 2018. They are:
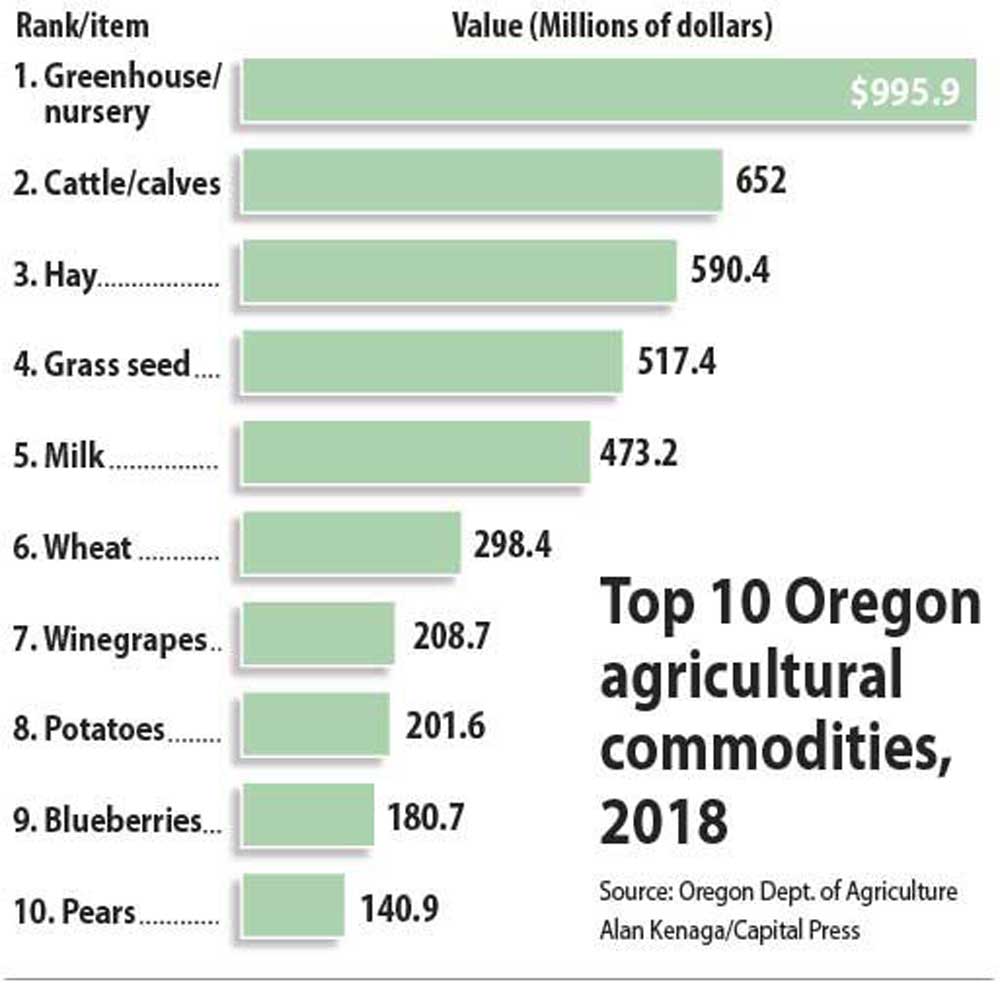
1) Greenhouse and nursery — $995.9 million
2) Cattle and calves — $652 million
3) Hay — $590.4 million
4) Grass seed — $517.4 million
5) Milk — $473.2 million
6) Wheat — $298.4 million
7) Winegrapes — $208.7 million
8) Potatoes — $201.6 million
9) Blueberries — $180.7 million
10) Pears — $140.9 million
11) Christmas trees — $119.9 million
12) Onions — $100.3 million
13) Hazelnuts — $91.8 million
14) Eggs — $85.1 million
15) Dungeness crab — $74.5 million
16) Cherries — $70.8 million
17) Hops — $69.8 million
18) Apples — $55.1 million
19) Sweet corn — $44.4 million
20) Mint for oil — $39.5 million